development methodology

Do users expect too much of applications?

Today, users expect more and more from their applications (both mobile and web).

In terms of performance, 47% of users now expect a page to load in 2 seconds or less. Apps like Instagram and Twitter set high expectations in terms of usability and functionality. And the cloud is everywhere – data is expected to be at our fingertips at all times.

As well as consumer expectations constantly rising, the expectations of businesses is also increasing. Now, anything that takes more than 3-6 months to start delivering real value is unlikely to get past the drawing board.

85% of businesses want to deploy apps within these time scales, but only 18% have processes in place to support this pace.

One solution Intechnica has recently adopted to meet and exceed these expectations is to adopt Rapid Application Development, which allows 80% of an application to be built using a drag-and-drop interface, leaving just 20% to traditional coding. This speeds up the development process to the point where a functional, useful web or mobile application can be deployed across various devices and delivering value to the business within weeks.

Case study – Delivering value within weeks

Intechnica, using Progress application development solutions, recently helped a leading European transport and logistics company to match the pace of business change by developing a mobile application to deliver new functionality within weeks, as opposed to the 3-6 months it would have taken using traditional application development methods.

The front-end of the company’s existing logistics, stock and order management application could not keep pace with the rate of change required to meet the new expectations of its users.

The solution was remarkably simple – but hugely effective. Today, smartphones are ubiquitous, so a simple mobile app was developed to replace several paper-based processes and mobilise the entire operation. GPS-based geolocation, time-stamping and photography functionality (all of which is available in almost every smartphone) was built into the app.

The business is now able to move with much greater pace and efficiency, enabling it to reduce costs and pro-actively manage its resource planning and invoicing functions with much greater accuracy.

The app was built, functional and delivering benefits to the business in just a matter of weeks.

Read more

Learn how businesses are addressing the increasing demand for faster development and time to value in an exclusive white paper produced by Intechnica. Head on over to the Intechnica website to download your copy now!

New SlideShare presentation – “Technical Debt 101”

We’ve just published a new slide deck on SlideShare titled “Technical Debt 101” (click the link to view, or watch embedded below).

The slide deck was written by Intechnica Technical Director, Andy Still. Make sure you take a look at Andy’s regular blog posts, including expanded posts on Technical Debt management, over at InternetPerformanceExpert.com.

Andy explains why Technical Debt doesn’t have to be negative, but it does have to be carefully managed. These slides give a quick run-down of best practice to approaching Technical Debt management.

We have extensive experience in managing Technical Debt. Get in touch to talk to us about managing your Technical Debt the right way.

Performance by Design

New “Performance by Design” blog network launched

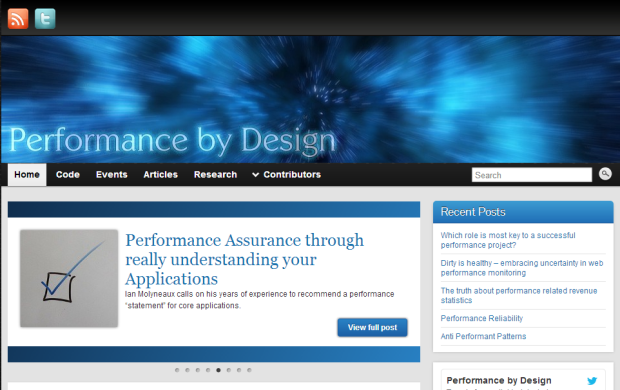
A new blog network focused on “Performance by Design” has recently been launched, with content provided by several of Intechnica’s Senior Consultants and Subject Matter Experts. Each blog is centred on a different aspect of IT performance, from design and development  through to testing, engineering and monitoring, with one “central hub” site pulling it all together (performancebydesign.co.uk).

Performance by Design is the the idea that to achieve fast, robust and reliable IT systems, performance must be built into them from the earliest stages, then monitored and managed throughout the software development life-cycle. We’ve adopted this approach in our work with clients like Channel 4 to shorten the software development life-cycle and improve results.

Performance by Design

All of the blogs in the network are easily accessible from the central PerformanceByDesign.co.uk page

Blogs within the Performance by Design network include:

Internet Performance Expert – Andy Still

Andy Still (Technical Director, co-founder) shares helpful how-to guides and opinions on the latest tools and techniques for developing fast, robust applications. Andy is well placed to offer his expertise, having previously developed applications capable of scaling to 100,000 transactions in a minute. His blog can be found at internetperformanceexpert.wordpress.com.

Top post: Persistent Navigation in jQuery Mobile

The Art of Application Performance Testing – Ian Molyneaux

With over 35 years of experience in IT, Ian, who is our Head of Performance, takes to his blog to impart wisdom around performance best practice. As the author of O’Reilly’s “The Art of Application Testing” book in 2009, Ian excels at communicating his knowledge in a clear, concise manner to readers. He mainly focuses on Performance testing and the wider world of Performance. Read what he has to say at ianmolyneaux.wordpress.com.

Top post: Performance Assurance through really understanding your Applications

Performance Testing Professional – Jason Buksh

Jason is a Senior Consultant at Intechnica with two decades in IT under his belt. Performance Testing Professional has been a source of quality tips and guides for performance testers for years, and continues to be a great resource with Jason at the helm. Keep up to date on his latest posts at perftesting.co.uk.

Top post: Creating a Performant System

Monitoring Web Performance – Larry Haig

Larry Haig, Senior Consultant at Intechnica, addresses the subject of External Performance Monitoring in his blog posts. With years of experience working with the top tools in the field for major clients, Larry has plenty of knowledge to share. See what he’s saying over at larryhaig.wordpress.com.

Top post: Dirty is healthy – embracing uncertainty in web performance monitoring

Channel 4 & Intechnica present “Performance in CI” at London Web Performance Group

Packed house at News International

Continuous Performance Testing was the hot topic at the London Web Performance Group of 20th March. Intechnica and Channel 4 were on hand to give a presentation highlighting the challenges around performance in CI to a packed room at the News International HQ.

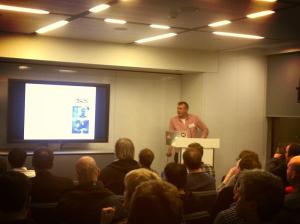
Andy Still outlining performance in CI. Photo: @Peran

Andy Still outlining performance in CI. Photo: @Peran

In fact, it was “standing room only” as Andy Still (Intechnica co-founder and Technical Director) kicked off the presentation by providing some background on performance in modern development approaches. He also addressed the debate on whether process or tooling is more inhibiting to this approach.

This was backed up by Mark Smith (Online QA Manager, Channel 4) who provided detailed technical insights to the recent “Scrapbook” project. Intechnica provided Channel 4 with a dedicated Performance consultant to oversee the performance and testing needs of the project to great success. Mark outlined the tools and processes implemented and the results achieved.

The presentation, hosted by News International, was well received by the 100+ attendees and sparked a spirited Q&A session afterwards. Comments in reviews on the Meetup.com site described the presentation as “great, insightful” and “excellent and useful”.

The presentation can be viewed on Slideshare now.

Web Performance Groups meet regularly in London and Manchester. If you are interested in attending a Web Performance Group meetup, you can join by following these links for the London and Manchester branches.

Mark Smith describes the Scrapbook project. Photo: @mesum98

Mark Smith describes the Scrapbook project. Photo: @mesum98

Specification by Example: Tooling Recommendations

Specification by example has a history that is closely linked to Ruby. The main software tools and development methods came from work on Ruby projects. As the method has started to attract a wider audience development tools and links to Microsoft .Net platforms have begun to appear.

At Intechnica our approach has been from two directions. An important aspect of the methodology is the use of continuous integration and code build, and that unit tests and inter-module testing is built into the software framework. This will prove that the code providing the functionality for the stories is working properly. So the development teams are looking to build continuous integration and unit tests into their software development processes. At the same time we don’t want to be tied to a specific and expensive development platform. Current processes are predicated on using Team Foundation Server – if the testing components are added to this it becomes an expensive solution.

The area that the solution assurance team are working in is the setting out the scope of the project and ensuring that the requirements reflect customer business requirements. Most importantly, it is then taking that living documentation and collaborating with the development team, PM’s and the customer to refine the details and identify the key business flows. Initially the outline ideas are put together using whiteboard sessions. These are then recorded into a mind-map software solution. There are many different products out there – many of which are open source. An important part of the selection criteria is that they are collaborative and that they have flexible import and export capabilities. It is no good having meetings and having working groups and then finding that they can only print output and can’t have shared input. The solution we have chosen is Mindmeister. Like many tools used for business analysis, testing and development, Mindmeister is a Software as a Service (SaaS) solution. This provides great flexibility and reduces the need to have software installed onto closed PCs or to use licensing dongles and allows easier upgrades. The software is free to use with limited number of mindmaps in the basic version; the personal version with greater number of maps and export formats is £4.99 a month, and the pro version is £9.99.

Once the project has a satisfactory outline and the scope has been captured with a rough outline of the solution we then use the Speclog solution to start to write the user stories. Speclog is a tool that is designed to look at business requirements and allow them to be described fully. For the story based process of specification by example this allows us to breakdown an application into its constituent actor goals, business goals and user stories. Each core feature is broken out into different user stories. Again it has strong collaboration characteristics. We have chosen a server version that allows a number of people to work on the same project. Linking back to specification by example, the output produced is in Gherkin language.

As part of this process, this is the time when the requirements traceability and the summary of requirements documentation is written. This is so there is an agreed understanding of the scope of the project. The tools are put in place for later test phases that will validate the delivery of the business capability.

This takes us back to our initial introduction to specification by example where we worked on user stories and used a Ruby tool called Cucumber that allowed the project to be detailed. Cucumber also produced and validated Gherkin code. It is a descriptive language that allows requirements to be described in the Given When Then format.

Given that I am a user of the system
I want to enter a valid order
So that products can be dispatched

In this example a number of characteristic scenarios would be used when describing the order entry feature. An order should have a valid product, reject certain types of product, have correct dispatch details, have a correct order scheme, contain shipping details, reject incorrect quantity amount and produce an order summary. From this the Gherkin user stories would then be produced and the developer would start to work on the features that provide this software capability.

And this brings us to our last software tool. In order that user stories can be discussed with the users and reviewed internally during development and testing, we need a tool that can bring together the Gherkin output in a Wiki style web site. This is key to the specification by example method where the output needs to be the living documentation and reflect the improvements and changes that are made to the requirements and how they are met through the project. Most importantly, both the SpecLog description (connected to the development cycle) and the tool used to monitor the progress of the requirements and display their maturing needed to be closely aligned. In theory this can be done by putting the Gherkin files into a version control system where the software that provides the capability will be developed, but because we don’t have the right connectivity and the development processes are not yet in place, we have put in a simpler solution. The user stories are being published into a file share and then put out into a Wiki style display tool called Relish. This can be used in two ways, directly by writing Gherkin feature files using simple editors such as Notepad++ or Sublime – plugins to these two products allow them to validate Gherkin code.

The linking together of the solution assurance and development processes are the next area for examination. When developing features there won’t necessarily be a direct one-to-one relationship between developed code modules and the stories. Some modules could be used across a number of stories – but in different functional capabilities. There will also be a much larger number of software modules and the relationship between the stories and the underlying code needs to be monitored. This area will require a lot of detailing work.

The final step will be to put the agreed user stories into our test management software tool (we use Practitest) as requirements and the write the core end-to-end process flows as test scenarios – with the test cases described within reflecting the different functional capabilities.

Conclusion

There are a lot of good quality software tools to help work with Specification by Example. Collaboration and flexibility are key – as is basic reliability. A time can be seen when there is a end-to-end link up to take requirements and produce testable artefacts. The next step in the process will be to work out how the development tools will hook into this process and more importantly, if we can follow the process fully, is it possible to produce a hybrid approach that combines traditional methods with this much leaner approach? The biggest challenge with this process is that it works from a top-down perspective – where traditional software methods use a combination of top-down and bottom-up to ensure that no gaps are inadvertently produced. It is addressing this issue that will be the most pressing challenge for specification by example.

See the other posts in this series by visiting David’s profile page.

Approaching Application Performance with TDD

This blog post was written by Intechnica Senior Developer Edward Woodcock. It originally appeared on his personal website, which you can view here

Test Driven Development (TDD) is a development methodology created by Kent Beck (or at least, popularised by him), which focuses on testing as not just the verification of your code, but the force that drives you to write the code in the first place.

Everyone who’s been exposed to TDD has come across the mantra:

Red. Green. Refactor. Repeat.

For the uninitiated that means you write a unit test that fails first. Yup, you aim to fail. Then, you write the simplest code that’ll make that test (and JUST that test) pass, which is the “Green” step (obviously you have to re-run the test for it to go green). Then you’re safe to refactor the code, as you know you’ve got a test that shows you whether it still works or not.

Test Cycle - Red is where I'm going to do my next dev step (or a long-outstanding issue I'm marking with a failing test)

So, that’s your standard dev cycle, RGRR. Every now and again you might drop out and have a poke around the UI if you’ve plugged anything in, but you’ll generally just be doing your RGRR, tiny little steps towards a working system.

Finally, when you’re happy with the release you’re working on, you deploy your code to production and go for a beer, safe in the knowledge that your code will work, right?

Continuous Integration - Useful for seeing your project's red/green status

Well, yes, and no. You’re safe in the knowledge that your business logic is “correct” as you understand it, and that your code is as robust as your tests are. But if your app is a large-scale internet (or even intranet) application with many concurrent users, you’ve only covered half the bases, because having the green tests that say that the system works as expected is useless if the system is so clogged that no-one can get on it in the first place. Even a system that simply degrades in performance under high- (or worse, normal-) load scenarios can leave a sour taste in the mouth of your otherwise happy customers.

So, the question is: how can you slide in performance as part of your RGRR cycle? Well, TDD says that the tests should drive the system, but they don’t specify what type of test you need to use. A common thought is to add automated UI tests into the mix, to be run in batches on a release, but why not add in a performance test as part of the build-verification process.

Going from our RGRR cycle, first we need a failing test. So, decide on a load model for the small section of the system you’re working on right now. Does it need to handle a hundred users at once, or will it likely be more like ten? It makes sense to go a little over what you might expect on an average day, just to give yourself some extra headroom.

Response Time Comparison - If your graph looks something like this you're probably doing OK!

Next, pick a load time that you think is acceptable for the action under test. If you’re loading search results, do they need to be quick, or is it more of a report that can be a fire-and-forget action for the user? Obviously input may be required from your client or Product Owner as to what they consider to be an acceptable time to carry out the action, as there’s nothing worse than being proud of the performance of something when it didn’t need to be fast, as then you’ve wasted effort that could be used elsewhere!

Now you’re going to want to run the test, in as close a match to your live environment as possible. At this point I need to point out that this is more of a theoretical process than a set of steps to take, as you’re unlikely to have one production-like environment for each developer! If needs be, group up with other developers in your team and run all your tests back-to-back. Make sure you have some sort of profiling tool available, as running the tests in a live-like environment is the key here, if you run them locally you’ll not be able to replicate the load effectively (unless you actually develop on the live server!).

If you’re using an iterative development approach and this is the first time you’ve run a test on this particular piece of functionality, most likely your test will fail. Your average response time under load will be above your target, and you may not even get up to the number of users you need to account for.

So, that’s the “Red” step accounted for, so how do you get to green? This is where we start to diverge from the RGRR pattern, as to get good performance you’ll need to refactor to make the test green. If you can’t run the same test, just take a few stabs through the UI manually to get some profiler results, and spend the time you’ve saved waiting for the test to complete thinking about how you can implement tests that can be run locally and from a load injector.

Profiling in action: DynaTrace giving us a realtime comparison. We're looking for some red bars, which indicate worse performance.

Hopefully your profile should have some lovely big red bars that show you where the hotspots are for your particular piece of functionality and you can use this information to refactor to make the algorithm less complex, the DB call faster, or to add some caching. If you’re being a rigorous TDD-adherent you’ll probably only want to make a single architectural change before you re-run the performance test, but in most cases you’ll want to do as many things as you can think of as performance tests on a live-like system won’t be available all the time.

Once you’re happy with that, re-run your test, this should be the “Green” step, if it’s not you should go back and refactor the code again until you hit your target. If you’re struggling to find enough headroom from code or architecture changes to hit your performance targets you most likely need to either leverage more hardware or refactor your UI to divert traffic to other areas.

Right then, we’ve done Red, Refactor, Green, next comes “Repeat”. If you think you can eke out more speed from the area you’re working on, you can go back and adjust your test load, but if you’ve gone for a known (or expected) production load with a little extra on top you probably don’t want to waste time on that. After all, when you’re practicing TDD you do just enough to hit your target, and then move on.

Repeat Load Test - When you do your repeat you can add in the "Change" column, which helps identify possible areas on concern for the next cycle.

So what’s next? Well, next you implement another piece of functionality, and do another load test. As you go along you’ll eventually build up quite a collection of load test scripts, one for each functionality area in the system, and you should run these together each time you add a new piece of functionality, just like in a unit testing session. However, I’d avoid doing tests on multiple new pieces of functionality at once the first time around, as you will likely come across a situation where a single piece of functionality knocks off performance across the board, giving you a big spreadsheet full of red boxes.

If you follow this method (RRGR) throughout the development lifetime of your system you should have a rock-stable system that can quantifiably cope with the expected amount of load, and then some. This is a great situation to be in when you’re planning new functionality, as you’ll rarely have to worry about whether you have enough headroom on your boxes to implement killer feature X, and can instead worry about really nailing that cool new bit of functionality.